Animated Bar Chart with D3
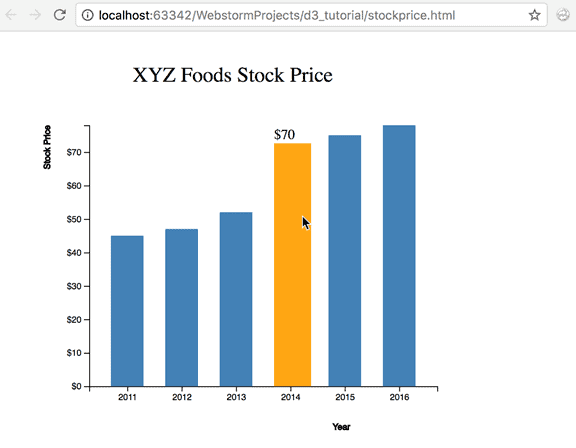
We can add transitions on mouse events. Let's add some event handling on hover of the individual bars, and display values in our bar chart visualization of the previous chapter.
<!doctype html>
<html>
<head>
    <style>
        .bar {
            fill: steelblue;
        }

        .highlight {
            fill: orange;
        }
</style>
    <script src="https://d3js.org/d3.v4.min.js"></script>
</head>
<body>
<svg width="600" height="500"></svg>
<script>

    var svg = d3.select("svg"),
        margin = 200,
        width = svg.attr("width") - margin,
        height = svg.attr("height") - margin;

    svg.append("text")
       .attr("transform", "translate(100,0)")
       .attr("x", 50)
       .attr("y", 50)
       .attr("font-size", "24px")
       .text("XYZ Foods Stock Price")

    var x = d3.scaleBand().range([0, width]).padding(0.4),
        y = d3.scaleLinear().range([height, 0]);

    var g = svg.append("g")
            .attr("transform", "translate(" + 100 + "," + 100 + ")");

    d3.csv("xyz.csv", function(error, data) {
        if (error) {
            throw error;
        }

        x.domain(data.map(function(d) { return d.year; }));
        y.domain([0, d3.max(data, function(d) { return d.value; })]);

        g.append("g")
         .attr("transform", "translate(0," + height + ")")
         .call(d3.axisBottom(x))
         .append("text")
         .attr("y", height - 250)
         .attr("x", width - 100)
         .attr("text-anchor", "end")
         .attr("stroke", "black")
         .text("Year");

        g.append("g")
         .call(d3.axisLeft(y).tickFormat(function(d){
             return "$" + d;
         }).ticks(10))
         .append("text")
         .attr("transform", "rotate(-90)")
         .attr("y", 6)
         .attr("dy", "-5.1em")
         .attr("text-anchor", "end")
         .attr("stroke", "black")
         .text("Stock Price");

        g.selectAll(".bar")
         .data(data)
         .enter().append("rect")
         .attr("class", "bar")
         .on("mouseover", onMouseOver) //Add listener for the mouseover event
         .on("mouseout", onMouseOut)   //Add listener for the mouseout event
         .attr("x", function(d) { return x(d.year); })
         .attr("y", function(d) { return y(d.value); })
         .attr("width", x.bandwidth())
         .transition()
         .ease(d3.easeLinear)
         .duration(400)
         .delay(function (d, i) {
             return i * 50;
         })
         .attr("height", function(d) { return height - y(d.value); });
    });

    //mouseover event handler function
    function onMouseOver(d, i) {
        d3.select(this).attr('class', 'highlight');
        d3.select(this)
          .transition()     // adds animation
          .duration(400)
          .attr('width', x.bandwidth() + 5)
          .attr("y", function(d) { return y(d.value) - 10; })
          .attr("height", function(d) { return height - y(d.value) + 10; });

        g.append("text")
         .attr('class', 'val')
         .attr('x', function() {
             return x(d.year);
         })
         .attr('y', function() {
             return y(d.value) - 15;
         })
         .text(function() {
             return [ '$' +d.value];  // Value of the text
         });
    }

    //mouseout event handler function
    function onMouseOut(d, i) {
        // use the text label class to remove label on mouseout
        d3.select(this).attr('class', 'bar');
        d3.select(this)
          .transition()     // adds animation
          .duration(400)
          .attr('width', x.bandwidth())
          .attr("y", function(d) { return y(d.value); })
          .attr("height", function(d) { return height - y(d.value); });

        d3.selectAll('.val')
          .remove()
    }

</script>
</body>
</html>
Let's walk through the two mouse event handlers we added to our code:
g.selectAll(".bar")
.data(data)
.enter().append("rect")
.attr("class", "bar")
.on("mouseover", onMouseOver)
.on("mouseout", onMouseOut)
.attr("x", function(d) { return x(d.year); })
.attr("y", function(d) { return y(d.value); })
.attr("width", x.bandwidth())
.transition()
.ease(d3.easeLinear)
.duration(400)
.delay(function (d, i) {
    return i * 50;
})
.attr("height", function(d) { return height - y(d.value); });
On selection of bar elements, we have added two new event handlers, viz. mouseover and mouseout and we are calling the respective functions to handle mouse events.This is done to apply animation when mouse hovers over a particular bar and goes out of it.
function onMouseOver(d, i) {

    d3.select(this).attr('class', 'highlight');
    d3.select(this)
      .transition()
      .duration(400)
      .attr('width', x.bandwidth() + 5)
      .attr("y", function(d) { return y(d.value) - 10; })
      .attr("height", function(d) { return height - y(d.value) + 10; });

    g.append("text")
     .attr('class', 'val') // add class to text label
     .attr('x', function() {
         return x(d.year);
     })
     .attr('y', function() {
         return y(d.value) - 15;
     })
     .text(function() {
         return [ '$' +d.value];  // Value of the text
     });
}
In the mouseover event, we want to increase the bar width and height, and the bar color of the selected bar (given by the 'this' object) to orange. For the color, we have added a class 'highlight' which changes the color of the selected bar to orange. Then, we have added a transition function to the bar for the duration of 400 milliseconds. So now, when we increase the width of the bar by 5px, and the height by 10px, the transition from previous width and height of the bar to the new width and height will be for the duration of 400 milliseconds. Note that we have also supplied a new 'y' value to the bar so that the bar does not get distorted due to the new height value.
Along with highlighting the selection by changing its width and height, we also want to display the bar value as a text. For this, we have appended a text element to the group element and specified the x and y positions of the text element. The text is given by [ '$' +d.value].
function onMouseOut(d, i) {
        d3.select(this).attr('class', 'bar');
        d3.select(this)
          .transition()
          .duration(400)
          .attr('width', x.bandwidth())
          .attr("y", function(d) { return y(d.value); })
          .attr("height", function(d) { return height - y(d.value); });

        d3.selectAll('.val')
          .remove()
    }
In the mouseout event, we want to remove the selection features that we had applied in the mouseover event. So, we revert the bar class to the original 'bar' class and also restore the original width and height of the selected bar. We have also restored the y value to the original value. d3.selectAll('.val').remove() removes the text value we had added during the bar selection.
Result: