What is D3?
D3 stands for Data-Driven Documents. It is an open-source JavaScript library developed by Mike Bostock to create custom interactive data visualizations in the web browser using SVG, HTML and CSS.
With the massive amount of data being generated today, communicating this information is getting difficult. Visual representations of data are the most effective means of conveying meaningful information and D3 provides a great deal of ease and flexibility to create these data visualizations. It is dynamic, intuitive and needs minimum amount of effort.
It is similar to Protovis in concept but while Protovis is used for static visualizations, D3 focuses more on interactions, transitions and transformations.
Official web site: d3js.org
D3 Source code: https://github.com/d3/d3
D3 Features
- Uses Web Standards: D3 is an extremely powerful visualization tool to create interactive data visualizations. It exploits the modern web standards: SVG, HTML and CSS to create data visualization.
- Data Driven: D3 is data driven. It can use static data or fetch it from the remote server in different formats such as Arrays, Objects, CSV, JSON, XML etc. to create different types of charts.
- DOM Manipulation: D3 allows you to manipulate the Document Object Model (DOM) based on your data.
- Data Driven Elements: It empowers your data to dynamically generate elements and apply styles to the elements, be it a table, a graph or any other HTML element and/or group of elements.
- Dynamic Properties: D3 gives the flexibility to provide dynamic properties to most of its functions. Properties can be specified as functions of data. That means your data can drive your styles and attributes.
- Types of visualization: With D3, there are no standard visualization formats. But it enables you to create anything from an HTML table to a Pie chart, from graphs and bar charts to geospatial maps.
- Custom Visualizations: Since D3 works with web standards, it gives you complete control over your visualization features.
- Transitions: D3 provides the transition() function. This is quite powerful because internally, D3 works out the logic to interpolate between your values and find the intermittent states.
- Interaction and animation: D3 provides great support for animation with functions like duration(), delay() and ease(). Animations from one state to another are fast and responsive to user interactions.
Advantages of D3
- D3.js is a Javascript library. So, it can be used with any JS framework of your choice like Angular.js, React.js or Ember.js.
- D3 focuses on data, so it is the most appropriate and specialized tool for data visualizations.
- D3 is open-source. So you can work with the source code and add your own features.
- It works with web standards so you don't need any other technology or plugin other than a browser to make use of D3.
- D3 works with web standards like HTML, CSS and SVG, there is no new learning or debugging tool required to work on D3.
- D3 does not provide any specific feature, so it gives you complete control over your visualization to customize it the way you want. This gives it an edge over other popular tools like Tableau or QlikView.
- Since D3 is lightweight, and works directly with web standards, it is extremely fast and works well with large datasets.
The Power of D3: Few Visualization Examples
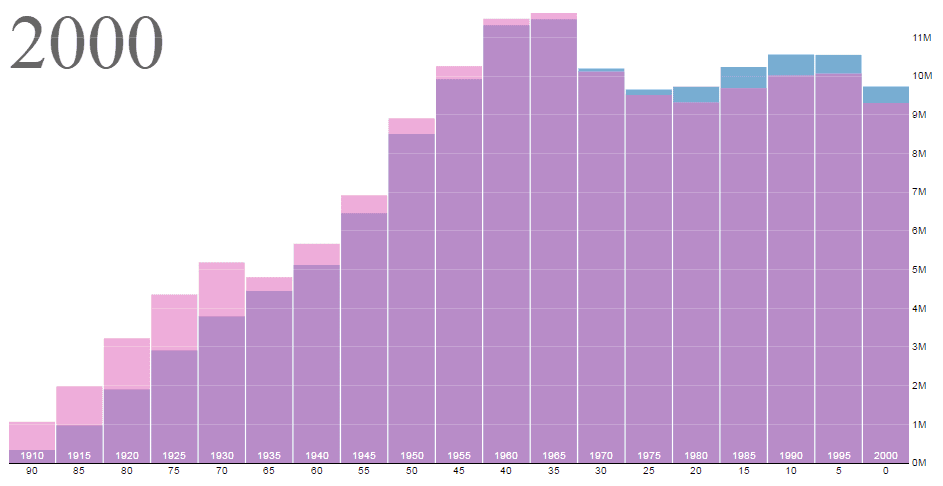
Bar Chart
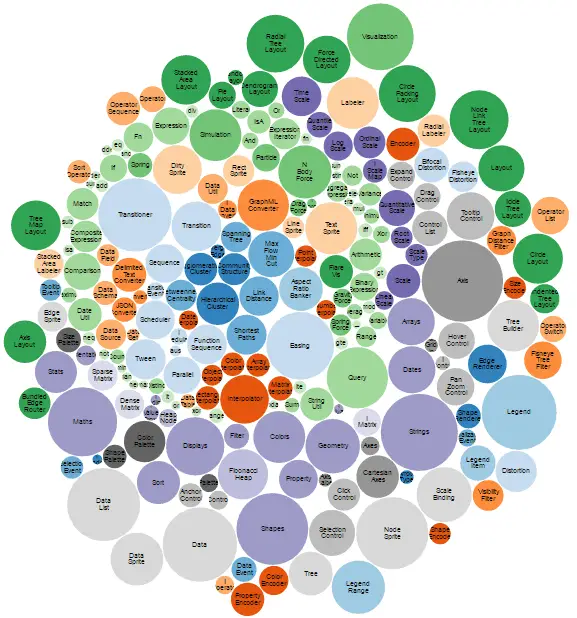
Bubble Chart
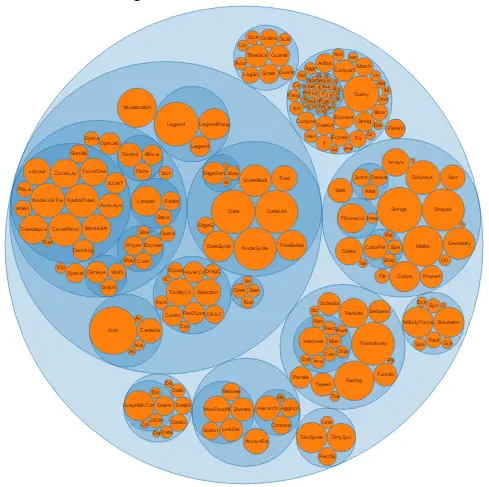
Circle Packing
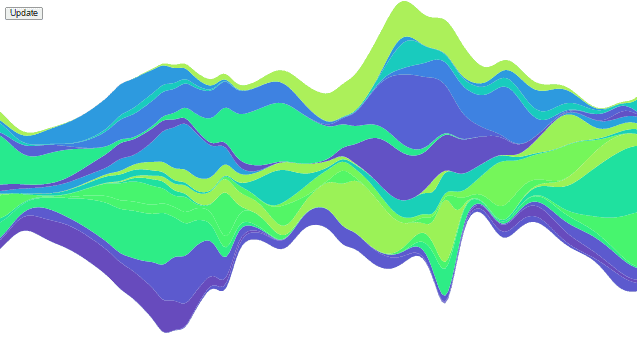
Stream Graph
Visit D3 Gallery for more visualization examples.