Node Inspector
In this section, we will use node inspector tool to debug a simple Node.js application contained in app.js file.
var fs = require('fs');

fs.readFile('test.txt', 'utf8', function (err, data) {

    debugger;

    if (err) throw err;

    console.log(data);
});
Node inspector is GUI based debugger. Install Node Inspector using NPM in the global mode by writing the following command in the terminal window (in Mac or Linux) or command prompt (in Windows).
npm install -g node-inspectorAfter installing run it using node-inspector command as shown below.
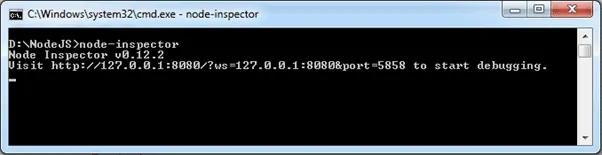
As you can see in the above figure, it will display an URL for debugging purpose. So, point your browser to http://127.0.0.1:8080/?ws=127.0.0.1:8080&port=5858 and start debugging. Sometimes, port 8080 might not be available on your computer. So you will get the following error.
Cannot start the server at 0.0.0.0:8080. Error: listen EACCES.
In this case, start the node inspector on a different port using the following command.
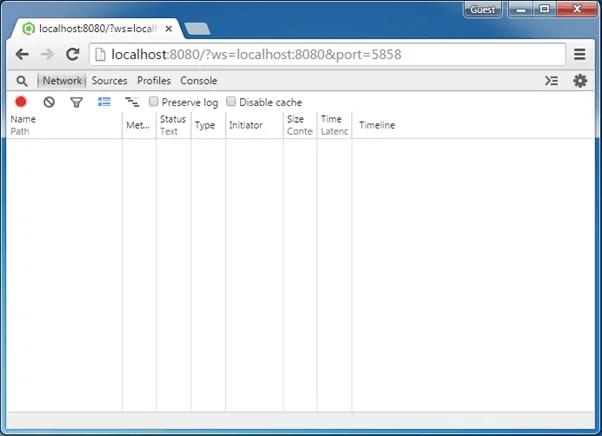
D:\>node-inspector --web-port=5500Now, open Google Chrome browser and enter the URL.
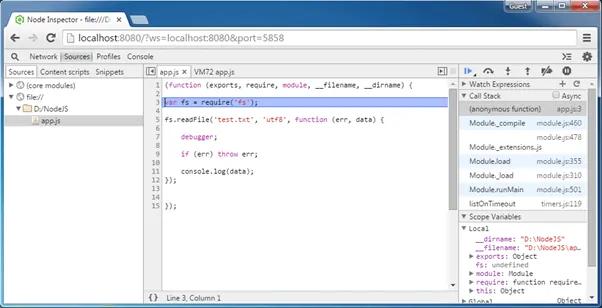
Now, open another terminal window or command prompt in Windows and start debugging using the following command.
> node --debug-brk app.jsRefresh the browser and you will see that it stops at the first line of the program as shown below.
Now, debug the program as a normal program in Chrome developer tool. Also, use watch expression on the right pane or hover the cursor on the variable to see the value as shown below.
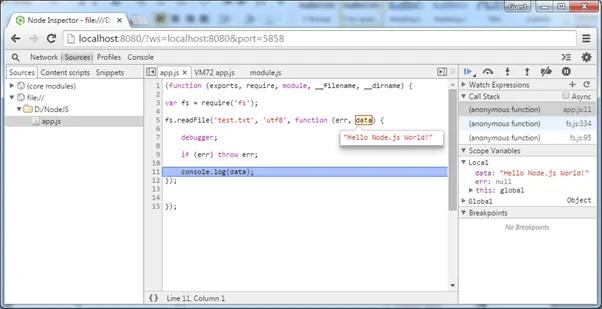
In this way, Node Inspector can be used to debug in Windows or MAC OS.