Axes in D3
In the previous chapters, we learnt about scales. In this chapter, we will learn to create axes using scales in D3.
The axes renders human-readable reference marks for scales. Graphs have two axes: the horizontal axis or the x-axis and the vertical axis or the y-axis.
D3 provides functions to draw axes. An axis is made of lines, ticks and labels. An axis uses scale, so each axis will need to be given a scale to work with.
D3 provides the following functions to draw axes.
| Axis Method | Description |
|---|---|
| d3.axisTop() | Creates top horizontal axis. |
| d3.axisRight() | Creates vertical right-oriented axis. |
| d3.axisBottom() | Creates bottom horizontal axis. |
| d3.axisLeft() | Creates left vertical axis. |
So far in our visualizations we haven't added any axes. Let's learn how to add x axis to a graph.
<body>
<script>
    var width = 400,
        height = 100;

    var data = [10, 15, 20, 25, 30];

    // Append SVG
    var svg = d3.select("body")
                .append("svg")
                .attr("width", width)
                .attr("height", height);

    // Create scale
    var scale = d3.scaleLinear()
                  .domain([d3.min(data), d3.max(data)])
                  .range([0, width - 100]);

    // Add scales to axis
    var x_axis = d3.axisBottom()
                   .scale(scale);

    //Append group and insert axis
    svg.append("g")
       .call(x_axis);

</script>
</body>The above example will display the following result.
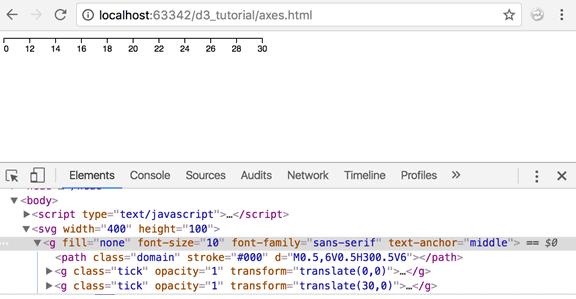
Let's walk through the above code:
var width = 400, height = 100; Like always, we have defined our SVG width and height as variables.
var data = [10, 15, 20, 25, 30]; defines our dataset as an array.
var svg = d3.select("body") .append("svg") .attr("width", width) .attr("height", height);Next, we create our SVG element and set its width and height.
var scale = d3.scaleLinear() .domain([d3.min(data), d3.max(data)]) .range([0, width - 100]);We create a linear scale and specify our domain and range. Observe how we have used d3.min and d3.max functions to get the minimum and maximum values from our dataset. Min would be 10 and max would be 30.
.range([0,width-100]) specifies the range [0,300]. So value 10 will be map to 0 and value 300 will be map to 30.
var x_axis = d3.axisBottom() .scale(scale);We use d3.axisBottom to create our x-axis and provide it with the scale we defined earlier.
svg.append("g") .call(x_axis);And finally, we append a group element and insert x-axis.
Similarly, we can create a vertical axis using d3.axisLeft() function as shown below.
<body>
<script>
    var width = 400, height = 400;

    var data = [10, 15, 20, 25, 30];
    var svg = d3.select("body")
                .append("svg")
                .attr("width", width)
                .attr("height", height);

    var scale = d3.scaleLinear()
                  .domain([d3.min(data), d3.max(data)])
                  .range([height/2, 0]);

    var y_axis = d3.axisLeft()
                  .scale(scale);

    svg.append("g")
       .attr("transform", "translate(50, 10)")
       .call(y_axis);

</script>
</body>This will draw y-axis in the browser as shown below.
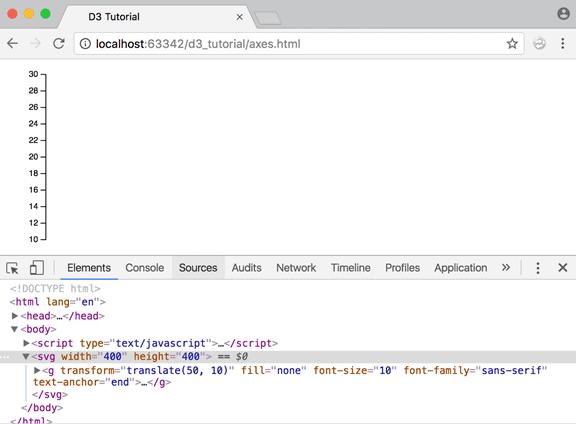
Let's understand the above example code.
var scale = d3.scaleLinear() .domain([d3.min(data), d3.max(data)]) .range([height/2, 0]);We created a linear scale and specified our domain and range using the data. We used d3.min and d3.max functions to get the minimum and maximum values from our dataset.
var y_axis = d3.axisLeft() .scale(scale);We use d3.axisLeft to create our y-axis and provide it with the scale we defined above.
svg.append("g") .attr("transform", "translate(50, 10)") .call(y_axis);Finally, we append a group element and call the y-axis function. So, all the components of the y-axis will be grouped under the group element. We then apply a translate transformation to align the y-axis to 50px right of the origin and 10px to the bottom of the origin. This ensures a better visual representation on the screen.
The d3.axisBottom() and d3.axisLeft() functions have been introduced in the latest version of D3 i.e. version 4. Earlier versions used d3.svg.axis() with orient("left") and orient("bottom") for y-axis and x-axis respectively.
Let's get both the axes together now!
<body>
<script>
var width = 400, height = 100;

var data = [10, 15, 20, 25, 30];
var svg = d3.select("body")
    .append("svg")
    .attr("width", width)
    .attr("height", height);

var xscale = d3.scaleLinear()
    .domain([0, d3.max(data)])
    .range([0, width - 100]);

var yscale = d3.scaleLinear()
        .domain([0, d3.max(data)])
        .range([height/2, 0]);

var x_axis = d3.axisBottom()
        .scale(xscale);

var y_axis = d3.axisLeft()
        .scale(yscale);

    svg.append("g")
       .attr("transform", "translate(50, 10)")
       .call(y_axis);

var xAxisTranslate = height/2 + 10;

    svg.append("g")
            .attr("transform", "translate(50, " + xAxisTranslate  +")")
            .call(x_axis)

</script>
</body>And the grand output:
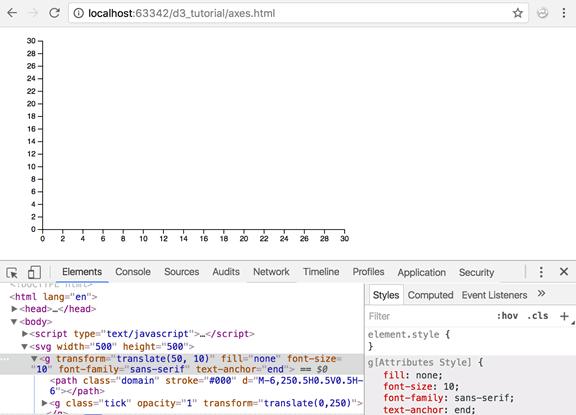
Great. That looks neat. Doesn't it?
Further Reading: Axis in D3
Now that we have learned about scales and axes, let's create a bar chart with scales and axes in the next chapter.