Create SVG Chart using D3
In the previous chapter, we learned to create SVG elements in D3. Here, we will learn how to create static SVG chart in D3.
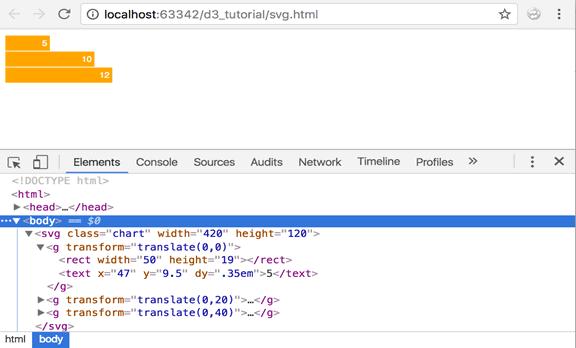
Let's create a bar chart in SVG with D3.js. For the bar chart, we will use<rect> elements for the bars and <text>elements to display our data values corresponding to the bars. The following is a simple SVG bar chart HTML which we will create using D3.
<!doctype html>
<html>
<head>
    <script src="https://d3js.org/d3.v4.min.js"></script>
</head>
<style>
    svg rect {
        fill: orange;
    }

    svg text {
        fill:white;
        font: 10px sans-serif;
        text-anchor: end;
    }
</style>
<body>
    <svg className="chart" width="420" height="120">
        <g transform="translate(0,0)">
            <rect width="50" height="19"></rect>
            <text x="47" y="9.5" dy=".35em">5</text>
        </g>
        <g transform="translate(0,20)">
            <rect width="100" height="19"></rect>
            <text x="97" y="9.5" dy=".35em">10</text>
        </g>
        <g transform="translate(0,40)">
            <rect width="120" height="19"></rect>
            <text x="117" y="9.5" dy=".35em">12</text>
        </g>
    </svg>
</body>
</html>The output of the above example in the browser:
Let's break down the explanation into two: 1) Geometry and 2) Styles
Geometry
You may have noticed the group element<g>that we have introduced to hold our bars. Each group element here holds the corresponding bar and its text together.
If you look at these <g> elements, you will notice that we had to hardcode our element positions. This is because SVG needs absolute positions with respect to the origin. Origin is always (0, 0) starting from the top-left of your screen.
Notice the transform attribute: transform="translate(0,20)"
In our <rect> and <text> elements, we provided the width and height attributes. But we also need to provide where these elements would be located on our screen. For this we use a transformation called translate. It essentially provides position coordinates for the elements relative to the origin. Other transform definitions are scale, rotate, skewX, and skewY. Read more about the transform specifications from w3.org.
Styles
When it comes to styles, we use classes to give styles to our elements. We use the below class to paint our bar <rect> elements orange.
  svg rect {
        fill: orange;
    }
Also, use the below CSS class to apply styles to our data values. SVG has a <text> element that can be used to display text output.
svg text {
        fill: white;
        font: 10px sans-serif;
        text-anchor: end;
    }
As you can see, some of the properties used in SVG are different from the properties used in HTML. For example, fill is used to apply colors. text-anchor is used to position our text towards the right end of the bars. We will learn more about styling SVG in the future chapters.
Now, let's create this SVG bar chart with D3.
<html>
<head>
    <script src="https://d3js.org/d3.v4.min.js"></script>
    <style>
        svg rect {
            fill: orange;
        }

        svg text {
             fill:white;
            font: 10px sans-serif;
            text-anchor: end;
        }
    </style>
</head>
<body>
<script>
        var data = [5, 10, 12];
        var width = 200,
        scaleFactor = 10,
        barHeight = 20;

        var graph = d3.select("body")
                  .append("svg")
                  .attr("width", width)
                  .attr("height", barHeight * data.length);

        var bar = graph.selectAll("g")
                  .data(data)
                  .enter()
                  .append("g")
                  .attr("transform", function(d, i) {
                        return "translate(0," + i * barHeight + ")";
                  });

    bar.append("rect")
       .attr("width", function(d) {
                return d * scaleFactor;
       })
       .attr("height", barHeight - 1);

    bar.append("text")
       .attr("x", function(d) { return (d*scaleFactor); })
       .attr("y", barHeight / 2)
       .attr("dy", ".35em")
       .text(function(d) { return d; });

</script>
</body>
</html>The above example will display the following chart in the browser.
Let's walk through the code step by step:
var data = [5, 10, 12];defines our data array.
var width = 200,
scaleFactor = 10,
barHeight = 20;
The above code defines three variables to use later in our program:
- width : Width of the svg
- scalefactor: Since our data values are too small, they need to be scaled to a pixel value that is visible on the screen.
- barHeight: This is the static height of our horizontal bars.
var graph = d3.select("body")
              .append("svg")
              .attr("width", width)
              .attr("height", barHeight * data.length);
We first select the document body and create a new SVG element and append it. We will build our bar graph inside this SVG element. We then set the width and height of our SVG. Height is calculated as bar height * number of data values. We have taken 20 as bar height and data array length is 3. So SVG height would be 60 px.
var bar = graph.selectAll("g")
               .data(data)
               .enter().append("g")
               .attr("transform", function(d, i) {
                   return "translate(0," + i * barHeight + ")";
               });
Next, we want to place each of our bars inside corresponding <g> elements. So here, we create our group elements. We also apply the translate transformation here. Each of our group elements needs to be positioned one below the other because we want to build a horizontal bar chart. So our translation formula will be (current element index * bar height).
bar.append("rect")
   .attr("width", function(d) {
        return d * scaleFactor;
   })
   .attr("height", barHeight - 1);
Now that we have our group elements ready, we will add the<rect>element for each bar. We have given it a width of (data value * scale factor) and height is (bar height - margin).
bar.append("text")
   .attr("x", function(d) { return (d*scaleFactor); })
   .attr("y", barHeight / 2)
   .attr("dy", ".35em")
   .text(function(d) { return d; });
Finally, we want to display our data values as text on each bar. Width is defined as (data value * scalefactor) Text elements do not support padding or margin. For this reason, we need to give it a "dy" offset. This is used to align the text vertically.
Thus, we can create a bar chart using D3. This is just the basics. We will create a more advanced level vertical bar chart with scales and axes in the next section.
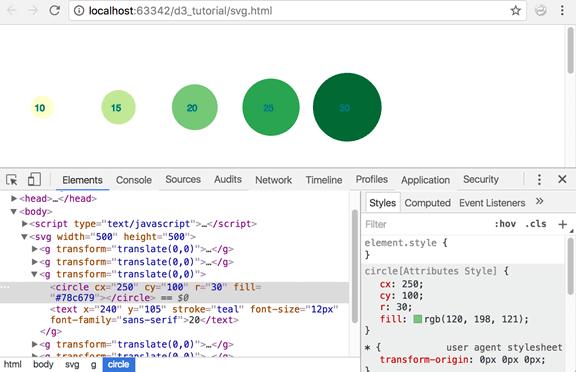
Let's look at another example to create circles dynamically from data, and style them.
var width = 500;
var height = 500;

var data = [10, 15, 20, 25, 30];
var colors = ['#ffffcc','#c2e699','#78c679','#31a354','#006837'];

var svg = d3.select("body")
            .append("svg")
            .attr("width", width)
            .attr("height", height);

var g = svg.selectAll("g")
            .data(data)
            .enter()
            .append("g")
            .attr("transform", function(d, i) {
                return "translate(0,0)";
            })

    g.append("circle")
      .attr("cx", function(d, i) {
            return i*100 + 50;
      })
      .attr("cy", function(d, i) {
            return 100;
      })
      .attr("r", function(d) {
            return d*1.5;
      })
      .attr("fill", function(d, i){
            return colors[i];
      })

    g.append("text")
     .attr("x", function(d, i) {
            return i * 100 + 40;
     })
     .attr("y", 105)
     .attr("stroke", "teal")
     .attr("font-size", "12px")
     .attr("font-family", "sans-serif")
     .text(function(d) {
            return d;
});The above example would create the following chart in the browser.
Let's walk through the code:
var width = 500; var height = 500;As before, we are keeping our width and height in variables
var data = [10, 15, 20, 25, 30]; defines our data array with five numbers.
var colors = ['#ffffcc','#c2e699','#78c679','#31a354','#006837']; defines array of colors. We will use this to give a color gradient to our circles - one color per circle.
var svg = d3.select("body")
            .append("svg")
            .attr("width", width)
            .attr("height", height);
Next, we select our body element and append the SVG to the body. We also specify the width and height of our SVG using the predefined variables; viz. width and height.
var g = svg.selectAll("g") creates group element to hold the circles.
.data(data) binds our data array to the group elements.
.enter() creates placeholders for our group elements.
.append("g") appends group elements to our page.
.attr("transform", function(d, i) {
        <span className="kwrd">return</span> <span className="str">"translate(0,0)"</span>;
 })
As we learnt earlier, translate is used to position your elements with respect to the origin. In this case, we are positioning it at the origin.
g.append("circle") appends our circle to the group.
.attr("cx", function(d, i) {
    return i*100 + 50;
 })
We set the x-coordinate of the center of each circle. Here, we are multiplying the circle's index with 100 and add some padding between the circles.
.attr("cy", function(d, i) {
    return 100;
})
Next, we set the y-coordinate of the center of each circle. Because we want our circles oriented in the same line horizontally, we have kept the y-coordinate uniform across our circles.
.attr("r", function(d) {
    return d*1.5;
})
Now, we set the radius of each circle. We want the size of our circles to correspond to the data values. So, bigger the data value, bigger our circle. We set the data value as the radius of each circle. But since our data values are quite small, they won't correspond to pixel values that will be clearly visible on the screen. To resolve this, we have multiplied our data value with a constant "1.5" to increase the circle's size.
.attr("fill", function(d, i){
    return colors[i];
})
The above code fills each circle with a color from our color array. We use the index of the data value to fetch its corresponding color from the color array. This will paint each circle in a different color.
g.append("text")
 .attr("x", function(d, i) {
     return i * 100 + 40;
 })
 .attr("y", 105)
 .attr("stroke", "teal")
 .attr("font-size", "12px")
 .attr("font-family", "sans-serif")
 .text(function(d) {
     return d;
 });
The above code adds data as a text value to each of the SVG elements that were created.
In the next chapter, we will learn about d3.scales and how to create axes for our graphs.