Create Bar Chart using D3
We learned about SVG charts, scales and axes in the previous chapters. Here, we will learn to create SVG bar chart with scales and axes in D3.
Let's now take a dataset and create a bar chart visualization. We will plot the share value of a dummy company, XYZ Foods, over a period from 2011 to 2016. The following XYZ.csv file stores share values:
year,value
2011,45
2012,47
2013,52
2014,70
2015,75
2016,78
Let's construct a vertical bar chart using the above XYZ.csv file that stores the values of XYZ stock prices.
Step 1: Start with creating the SVG and defining the scales for our bar chart as shown below.
<body>
<svg width="600" height="500"></svg>
<script>

    var svg = d3.select("svg"),
        margin = 200,
        width = svg.attr("width") - margin,
        height = svg.attr("height") - margin;


    var xScale = d3.scaleBand().range ([0, width]).padding(0.4),
        yScale = d3.scaleLinear().range ([height, 0]);

    var g = svg.append("g")
               .attr("transform", "translate(" + 100 + "," + 100 + ")");

</script>
</body>
Let's walkthrough the above code:
var svg = d3.select("svg"), margin = 200, width = svg.attr("width") - margin, height = svg.attr("height") - margin;We have created an SVG element with a width of 600px and height of 500px.
In our D3 program, we have adjusted the SVG width and height by adding some margin to the SVG. We have stored this value in a variable called margin so that we can adjust this value anytime we want in one place.
Next, we define our scales for the x-axis and y-axis. We will have to create two axes, so we need to have two scales for two axes.
var xScale = d3.scaleBand().range ([0, width]).padding(0.4),
The above code snippet defines scales for x axis. We use d3.scaleBand() for the x-axis. scaleBand() is used to construct a band scale. This is useful when our data has discrete bands. In our case, these are the year values - 2011, 2012, 2013, etc. We would need to provide a domain and range to our scale function. Remember domain is the input and range is the output. The scaleBand() function creates an empty domain that we can specify after loading our data. The range for the band is the width of the SVG. Also, since we have discrete bands, it would be nice to have some space or padding between the bars. For this, we add a padding of 0.4 to our discrete scale. You can change the padding value to increase or decrease the space between your bars.
yScale = d3.scaleLinear().range ([height, 0]);
The above defines a linear scale for the y-axis since this axis will show our stock prices. Since this is the vertical axis, the range here would be the height of the SVG.
var g = svg.append("g").attr("transform", "translate(" + 100 + "," + 100 + ")");
The above code added a group element to our SVG. We will add our axes and bars to the group element. We add a transform attribute to position our graph with some margin.
Step 2: Let's load our data from the CSV file and add axes to the SVG.
<body>
<svg width="600" height="500"></svg>
<script>

    var svg = d3.select("svg"),
        margin = 200,
        width = svg.attr("width") - margin,
        height = svg.attr("height") - margin;


    var xScale = d3.scaleBand().range ([0, width]).padding(0.4),
        yScale = d3.scaleLinear().range ([height, 0]);

    var g = svg.append("g")
               .attr("transform", "translate(" + 100 + "," + 100 + ")");

    d3.csv("XYZ.csv", function(error, data) {
        if (error) {
            throw error;
        }

        xScale.domain(data.map(function(d) { return d.year; }));
        yScale.domain([0, d3.max(data, function(d) { return d.value; })]);

        g.append("g")
         .attr("transform", "translate(0," + height + ")")
         .call(d3.axisBottom(xScale));

        g.append("g")
         .call(d3.axisLeft(yScale).tickFormat(function(d){
             return "$" + d;
         }).ticks(10))
         .append("text")
         .attr("y", 6)
         .attr("dy", "0.71em")
         .attr("text-anchor", "end")
         .text("value");
});
</script>
</body>
Let's walkthrough the above code:
d3.csv("XYZ.csv", function(error, data) {
    <span className="kwrd">if</span> (error) {
        <span className="kwrd">throw</span> error;
    }
});This step loads the XYZ.csv file using the d3.csv() method. We have added error handling in case the file fails to load.
xScale.domain(data.map(function(d) { return d.year; }));
Now that we have loaded our data, we can provide our domain values to the x and y scales. The above code provides x axis. We use data.map() to map our discrete year values to the x scale.
yScale.domain([0, d3.max(data, function(d) { return d.value; })]);
And we use d3.max() function to input our domain [0,max] value for y axis.
The following code adds axes to the SVG.
g.append("g")
 .attr("transform", "translate(0," + height + ")")
.call(d3.axisBottom(xScale));We add another group element to have our x-axis grouped under one group element. We then use the transform attribute to shift our x-axis towards the bottom of the SVG. We then insert x-axis on this group element using .call(d3.axisBottom(x)).
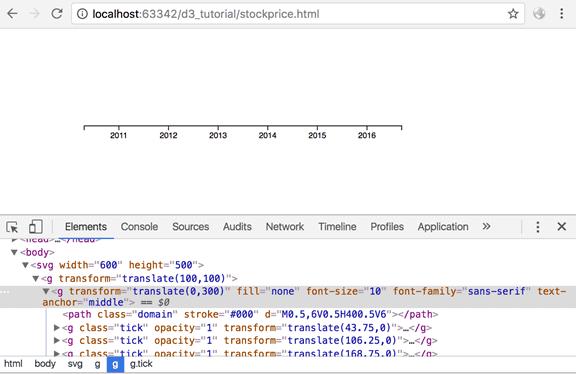
This is how the output looks at this point:
Next, we want to add the y-axis.
g.append("g") .call(d3.axisLeft(y)
As with x-axis, we add another group element to hold the y-axis and its components. We add the y-axis using .call(d3.axisLeft(y)).
.tickFormat(function(d){
                    return "$" + d;
}).ticks(10)Since our y-axis depicts a currency value, we have formatted our ticks using the tickFormat() method. We have also specified the number of ticks we would like our y-axis to have using ticks(10).
Let's see how the output looks now:
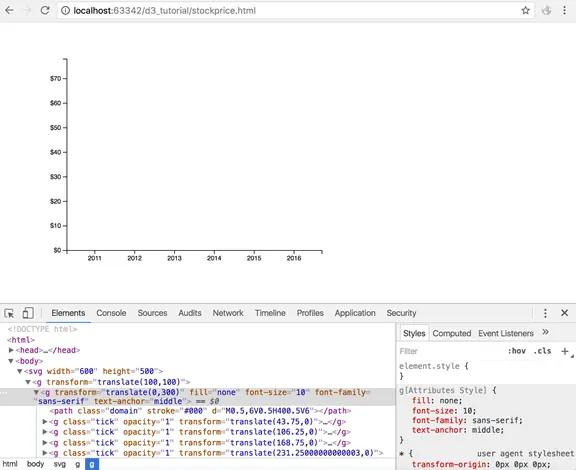
Ok, so now we have added both the axes.
Step 3: Next, we want to create bars corresponding to the data values.
Since this is a vertical bar graph, the chart width will be fixed and the bar width will be variable depending on the dataset size. We will calculate the bar width by diving the chart width by the dataset size.
<!doctype html>
<html>
<head>
    <style>
        .bar {
            fill: steelblue;
        }
    </style>
    <script src="https://d3js.org/d3.v4.min.js"></script>
</head>
<body>
<svg width="600" height="500"></svg>
<script>
var svg = d3.select("svg"),
            margin = 200,
            width = svg.attr("width") - margin,
            height = svg.attr("height") - margin


var xScale = d3.scaleBand().range([0, width]).padding(0.4),
            yScale = d3.scaleLinear().range([height, 0]);

var g = svg.append("g")
            .attr("transform", "translate(" + 100 + "," + 100 + ")");

    d3.csv("XYZ.csv", function(error, data) {
        if (error) {
            throw error;
        }

        xScale.domain(data.map(function(d) { return d.year; }));
        yScale.domain([0, d3.max(data, function(d) { return d.value; })]);

        g.append("g")
         .attr("transform", "translate(0," + height + ")")
         .call(d3.axisBottom(xScale));

        g.append("g")
         .call(d3.axisLeft(yScale).tickFormat(function(d){
             return "$" + d;
         }).ticks(10));


        g.selectAll(".bar")
         .data(data)
         .enter().append("rect")
         .attr("class", "bar")
         .attr("x", function(d) { return xScale(d.year); })
         .attr("y", function(d) { return yScale(d.value); })
         .attr("width", xScale.bandwidth())
         .attr("height", function(d) { return height - yScale(d.value); });
    });
</script>
</body>
</html>
Let's see how we added the bars:
g.selectAll(".bar")
 .data(data)
.enter().append("rect")We have created dynamic bars with our data using the SVG rectangle element.
.attr("class", "bar")
We also add a class "bar" to the rectangle element.
.bar {
        fill: steelblue;
}Next, we need to specify the x and y positions of each of the bars and provide a width and height to the bars.
.attr("x", function(d) { return x(d.year); })
We use the x scale created earlier and pass the year value from our data. The x scales returns the corresponding x value from the range specified to our scale. In this case, it is the width of the SVG.
.attr("y", function(d) { return y(d.value); })
Similarly, we pass the data value to our y scale and receive the corresponding y value from the y range.
.attr("width", xScale.bandwidth())
The width of our bars would be determined by the scaleBand() function. So, the x-scale returns a calculated bandwidth from the range and padding provided to the x-scale.
.attr("height", function(d) { return height - yScale(d.value); })
The height of the bar would be calculated as height - yScale(d.value). This would be the height of the SVG minus the corresponding y-value of the bar from the y-scale. Remember that the y-value here would be the tip of the bar since it is calculated from the origin and origin is at (0,0).
And the output now is:
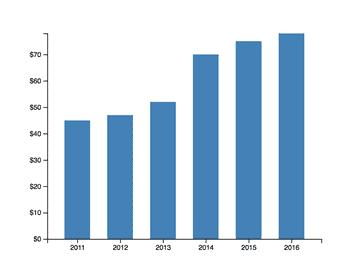
We have created our data-driven visualization!
Add Labels to Bar Chart
To add labels, we need to append text elements to our SVG. We will need labels for the x-axis and y-axis. We can also add a title to our visualization.
For the visualization title, let's add a text element to the SVG:
svg.append("text")
   .attr("transform", "translate(100,0)")
   .attr("x", 50)
   .attr("y", 50)
   .attr("font-size", "24px")
   .text("XYZ Foods Stock Price")
For x-axis, append the following text element to the x-axis group element:
g.append("g")
 .attr("transform", "translate(0," + height + ")")
 .call(d3.axisBottom(xScale))
 .append("text")
 .attr("y", height - 250)
 .attr("x", width - 100)
 .attr("text-anchor", "end")
 .attr("stroke", "black")
 .text("Year");
For y-axis, append the following text element to the y-axis group element:
g.append("g")
 .call(d3.axisLeft(yScale)
 .tickFormat(function(d){
     return "$" + d;
 }).ticks(10))
 .append("text")
 .attr("transform", "rotate(-90)")
 .attr("y", 6)
 .attr("dy", "-5.1em")
 .attr("text-anchor", "end")
 .attr("stroke", "black")
 .text("Stock Price");
The following is a full bar chart example code.
<!doctype html>
<html>
<head>
    <style>
        .bar {
            fill: steelblue;
        }
    </style>
    <script src="https://d3js.org/d3.v4.min.js"></script>
<body>
<svg width="600" height="500"></svg>
<script>

    var svg = d3.select("svg"),
        margin = 200,
        width = svg.attr("width") - margin,
        height = svg.attr("height") - margin

    svg.append("text")
       .attr("transform", "translate(100,0)")
       .attr("x", 50)
       .attr("y", 50)
       .attr("font-size", "24px")
       .text("XYZ Foods Stock Price")

    var xScale = d3.scaleBand().range([0, width]).padding(0.4),
        yScale = d3.scaleLinear().range([height, 0]);

    var g = svg.append("g")
               .attr("transform", "translate(" + 100 + "," + 100 + ")");

    d3.csv("XYZ.csv", function(error, data) {
        if (error) {
            throw error;
        }

        xScale.domain(data.map(function(d) { return d.year; }));
        yScale.domain([0, d3.max(data, function(d) { return d.value; })]);

        g.append("g")
         .attr("transform", "translate(0," + height + ")")
         .call(d3.axisBottom(xScale))
         .append("text")
         .attr("y", height - 250)
         .attr("x", width - 100)
         .attr("text-anchor", "end")
         .attr("stroke", "black")
         .text("Year");

        g.append("g")
         .call(d3.axisLeft(yScale).tickFormat(function(d){
             return "$" + d;
         })
         .ticks(10))
         .append("text")
         .attr("transform", "rotate(-90)")
         .attr("y", 6)
         .attr("dy", "-5.1em")
         .attr("text-anchor", "end")
         .attr("stroke", "black")
         .text("Stock Price");

        g.selectAll(".bar")
         .data(data)
         .enter().append("rect")
         .attr("class", "bar")
         .attr("x", function(d) { return xScale(d.year); })
         .attr("y", function(d) { return yScale(d.value); })
         .attr("width", xScale.bandwidth())
         .attr("height", function(d) { return height - yScale(d.value); });
    });
</script>
</body>
</html>
The above code will result in the following bar chart visualization.
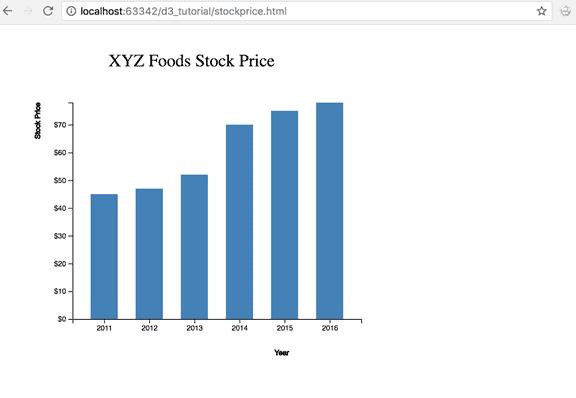
Thus, we can create a bar chart using D3.